How to Use a Project Analytics Dashboard in Construction for Data-Driven Management
Learn how to use a project analytics dashboard in construction to prevent budget overruns, track resources in real-time, and make data-driven decisions.
by Sophia Bennet
|
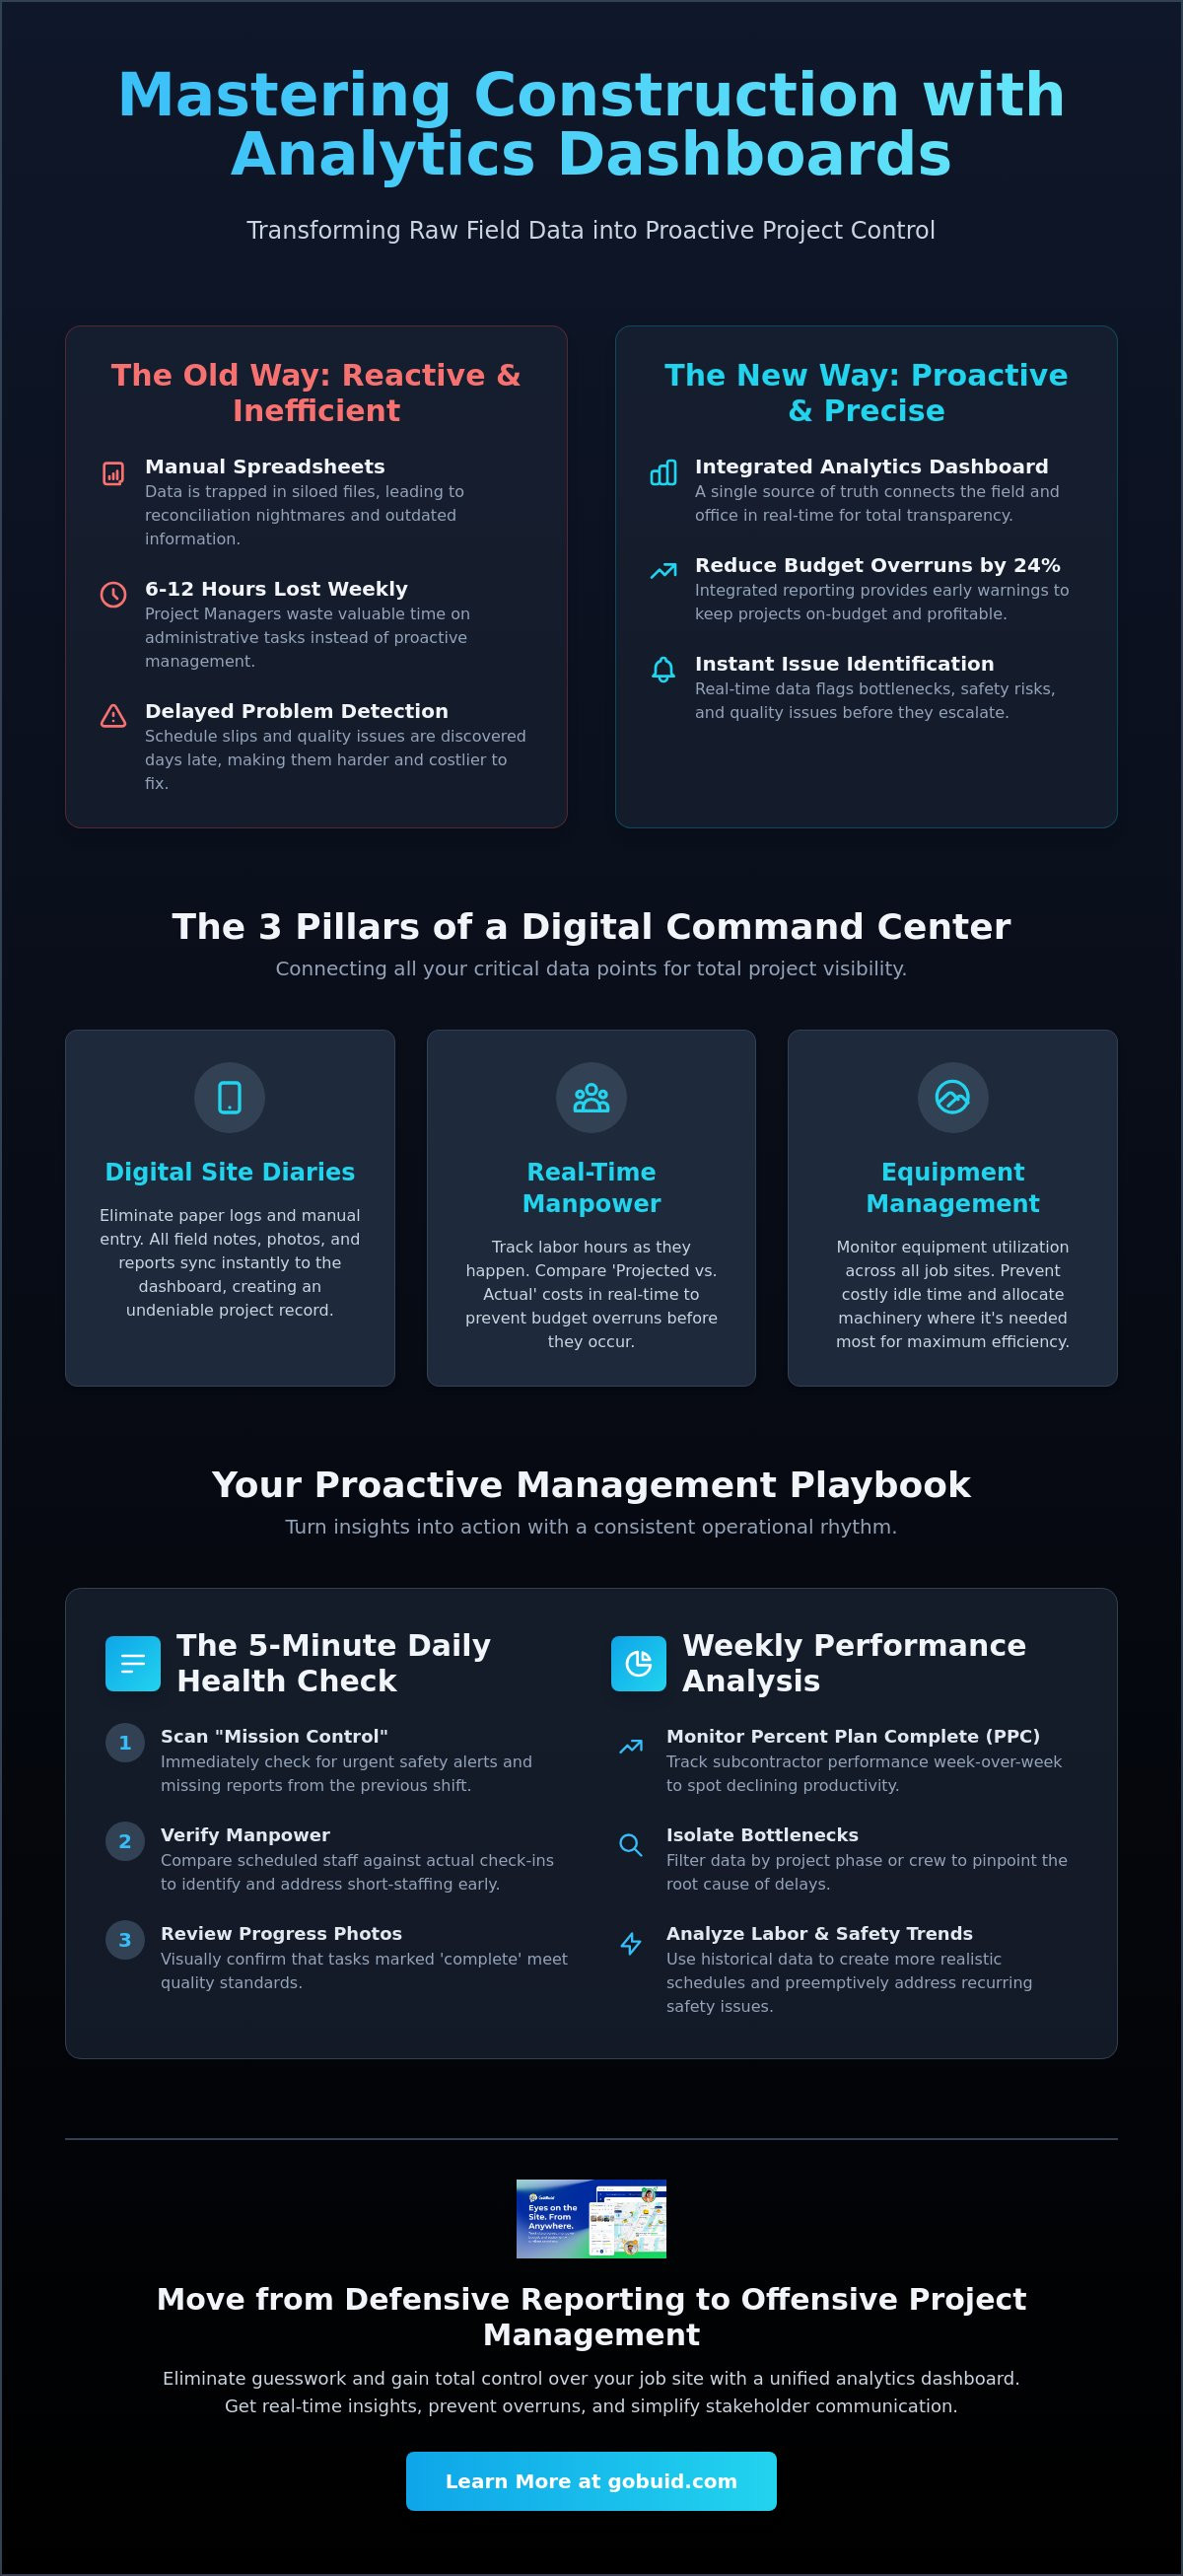
Construction firms that use integrated reporting can reduce budget overruns by as much as 24 percent compared to those relying on manual spreadsheets. Yet, many project managers still lose 6 to 12 hours every week to administrative reconciliation. It's a drain on resources that delays critical decisions. You've likely experienced the frustration of discovering a schedule slip days after it happened because your field data was trapped in a paper diary or a siloed spreadsheet. This guide explains how to use a project analytics dashboard in construction to eliminate those gaps and regain control over your job site.
We agree that manual data entry is a liability your profit margins can't afford. You need a unified data point that connects the field to the office in real time. We'll show you how to transform raw site documentation into early warning signals that flag project overruns before they escalate. You'll learn how to gain total visibility into manpower and equipment usage while generating stakeholder reports in a single click. It's time to move past reactive fixes and start managing your projects with digital precision.
Key Takeaways
- Connect digital site diaries to your dashboard to create a unified data point for total operational transparency across every location.
- Learn how to use a project analytics dashboard in construction to transform raw field data into early warning signals for potential budget overruns.
- Establish a daily "Mission Control" routine that uses real-time manpower and equipment tracking to identify and resolve site bottlenecks immediately.
- Use trend analysis to spot recurring safety or quality issues, allowing you to move from defensive reporting to offensive project management.
- Simplify stakeholder communication by using one-click reporting to provide clear, data-driven evidence for schedule adjustments and resource allocation.
- ⭐ Learn more about GoBuid's feature - without the heavy enterprise price tag
Table of Contents
-
The Foundation of Construction Analytics: Connecting Field Data to the Dashboard
-
How to Use Your Project Analytics Dashboard for Proactive Management
-
Optimizing Project Performance with Data-Driven Decision Making
The Foundation of Construction Analytics: Connecting Field Data to the Dashboard
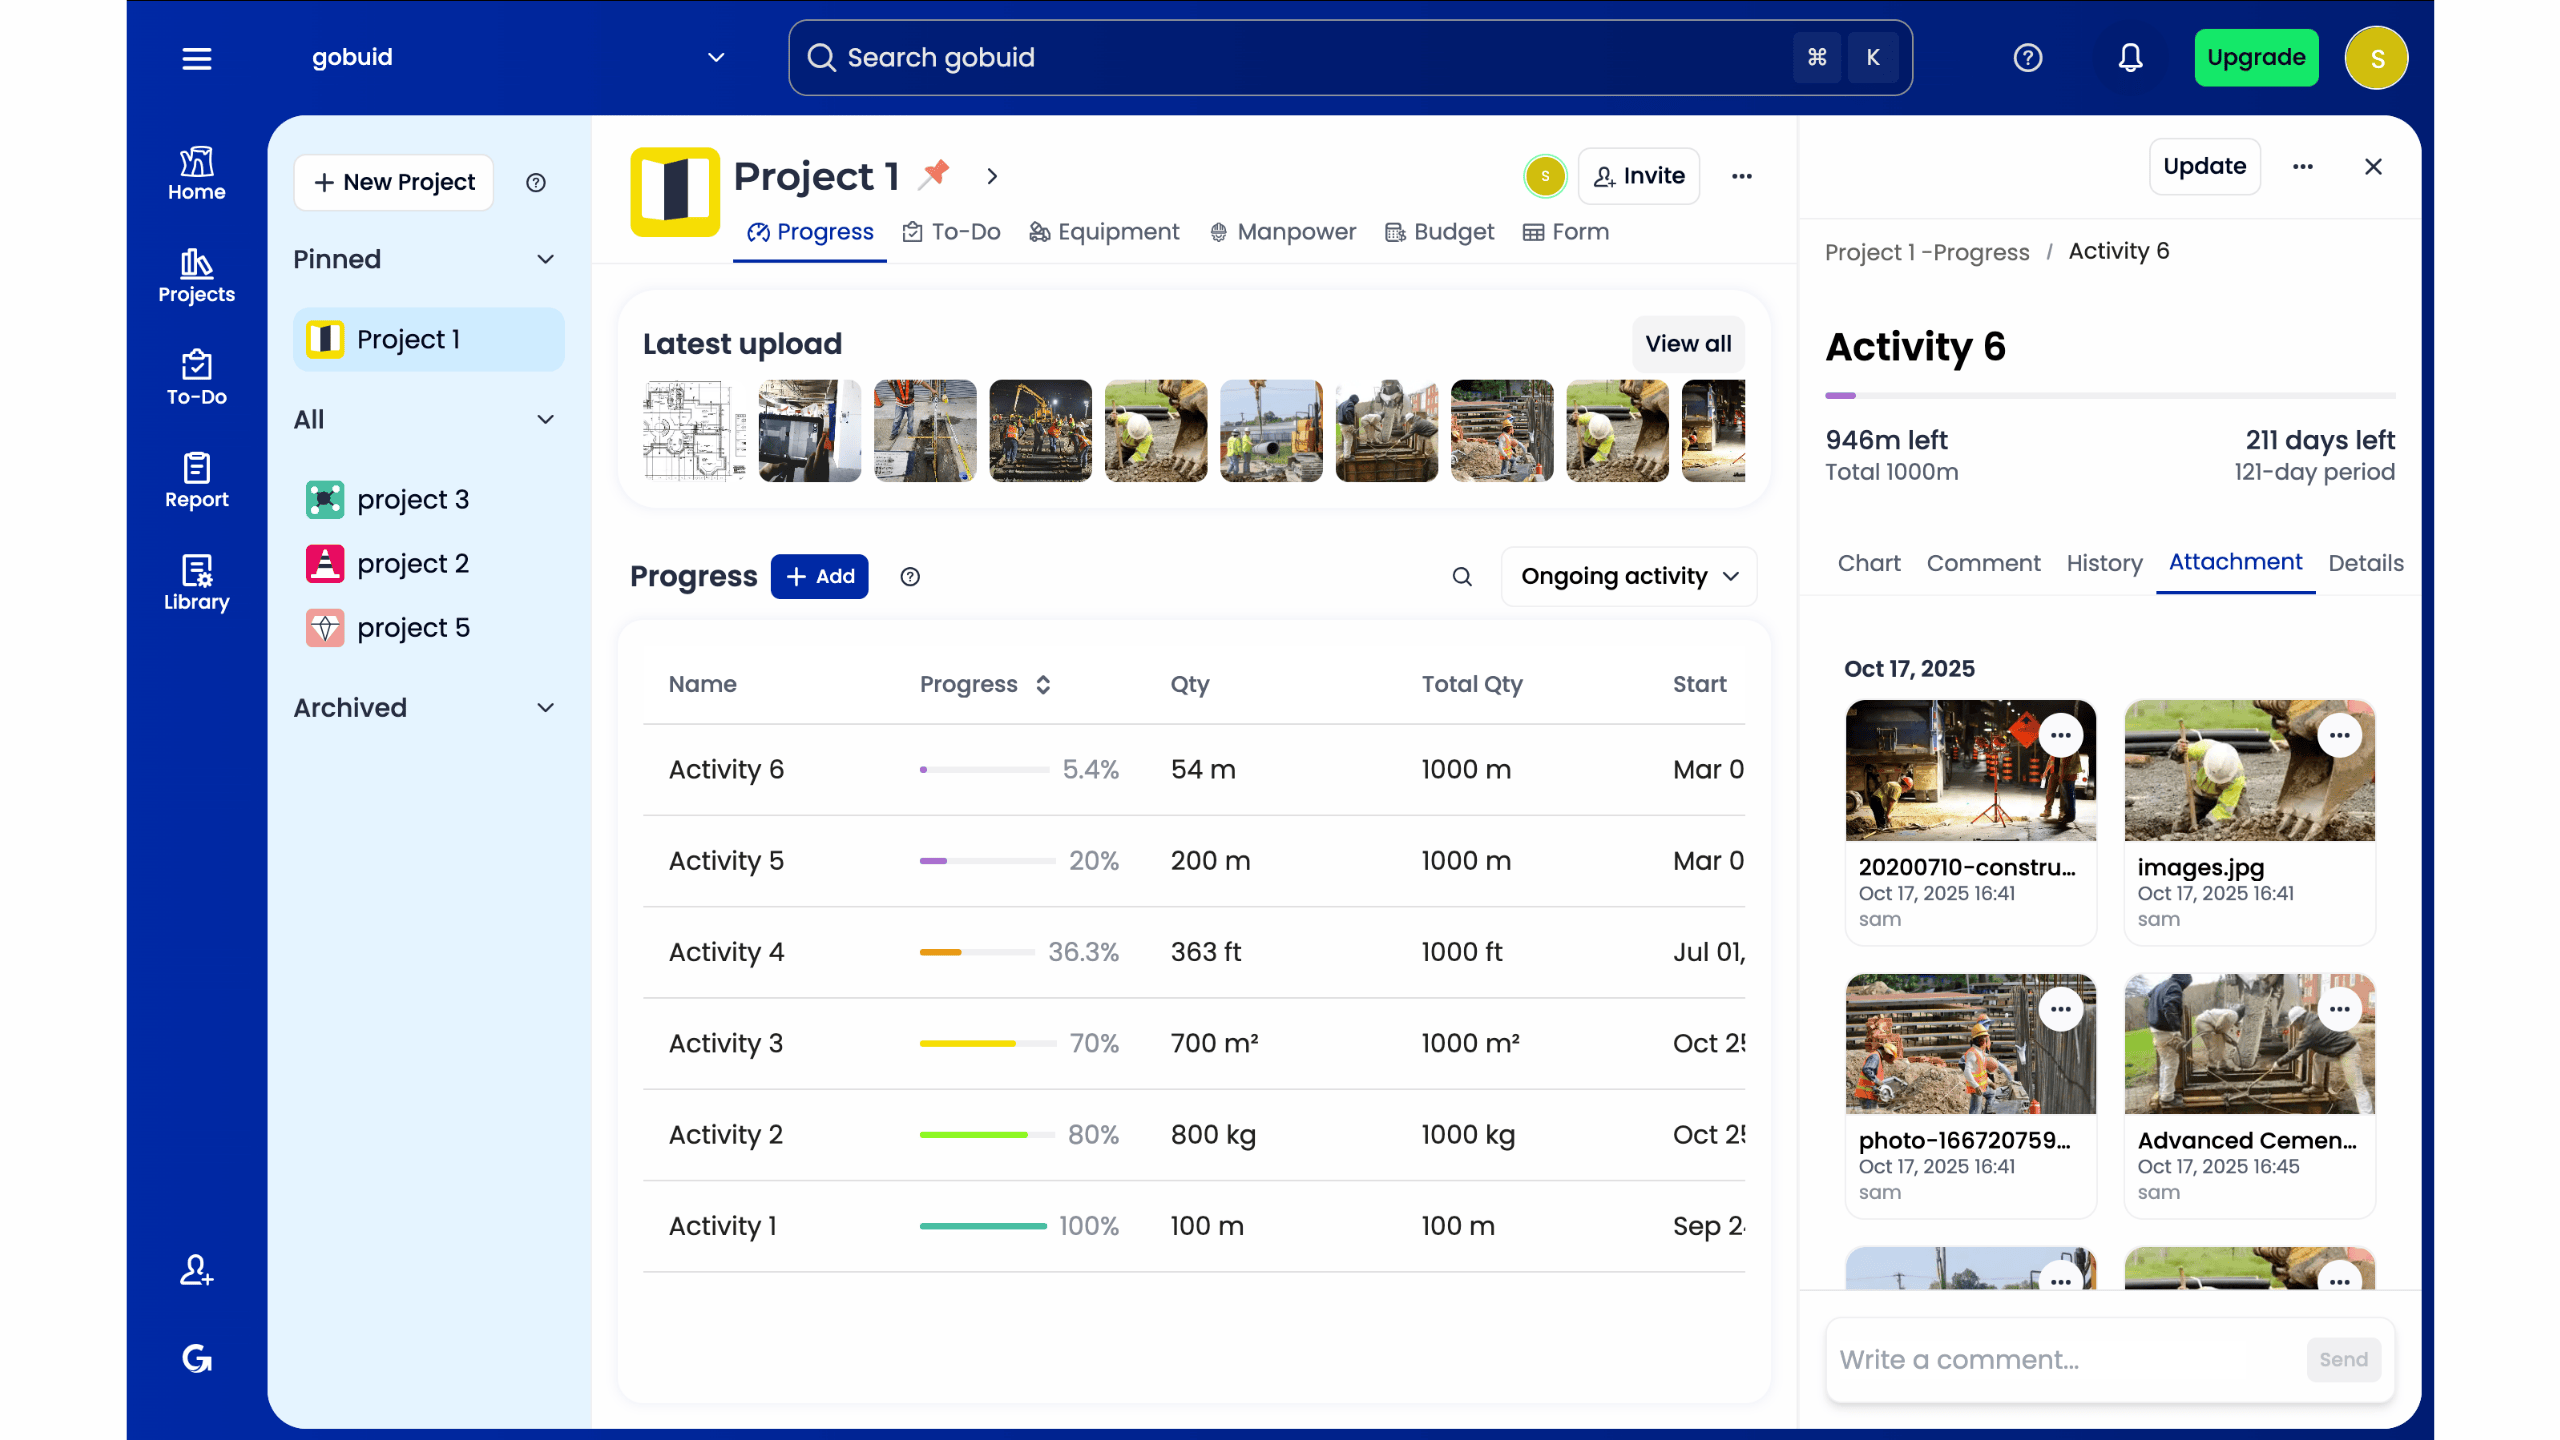
A project analytics dashboard acts as the visual command center for your site operations. It transforms fragmented updates into a unified data point, ensuring every stakeholder works from a single source of truth. Without this integration, managers often fall into the "Friday afternoon spreadsheet scramble," wasting hours reconciling outdated notes. Effective construction management requires moving away from these manual delays toward real-time digital inputs.
To better understand this concept, watch this helpful video:
When you understand how to use a project analytics dashboard in construction, you prioritize metrics that drive profitability. This starts with tracking manpower, equipment utilization, and safety compliance. These core pillars provide the transparency needed to spot waste and prevent small delays from ballooning into major overruns. Real-time data ensures that your reporting is a reflection of current site reality, not a memory of what happened last week.
Eliminating Data Silos with Digital Site Diaries
Data silos occur when field notes remain trapped in paper logs or personal messaging apps. Implementing a Digital Site Diary ensures that every entry automatically populates your dashboard widgets. This immediate sync eliminates manual entry errors and provides instant photo documentation. High-quality progress photos offer more than just a visual record; they provide the context needed for accurate progress tracking and dispute resolution.
The Role of Real-Time Manpower and Equipment Tracking
Labor is often the most volatile cost on any project. Tracking labor hours in real time allows you to adjust the "Projected vs. Actual" cost curve before the budget is blown. Efficient Equipment Management data prevents costly idle time by identifying underutilized machinery across different zones. By centralizing these inputs, you gain the clarity required to move resources exactly where they're needed most.
How to Use Your Project Analytics Dashboard for Proactive Management
Static data is a liability. Managing a site effectively requires a rhythm that moves faster than a weekly meeting. You don't wait for a monthly budget report to discover a resource leak. Instead, you use your dashboard to find it now. Research on Big Data Analytics for Construction confirms that real-time progress tracking is the only way to effectively mitigate risk and control costs. Knowing how to use a project analytics dashboard in construction means turning these digital insights into a daily operational checklist.
Daily Health Checks: The 5-Minute Morning Review
Success on a job site is built on small, consistent corrections. Start every morning with a rapid assessment to ensure the project remains on track. Follow these three steps:
-
Step 1: Open the Mission Control view. Immediately scan for urgent safety alerts or reports that were not submitted during the previous shift.
-
Step 2: Compare today’s scheduled manpower against actual site check-ins. If a subcontractor is short-staffed, you can adjust your expectations or reallocate resources before the day is wasted.
-
Step 3: Review progress photos from the last 24 hours. Visual verification ensures that "completed" tasks actually meet your quality standards.
Weekly Performance Analysis and Risk Mitigation
While daily checks handle immediate fires, weekly analysis prevents future ones. Use your dashboard to monitor "Percent Plan Complete" (PPC). If your subcontractors hit 95 percent of milestones last week but only 70 percent this week, you have a bottleneck. You must isolate these performance issues by filtering data by specific project phases. This allows you to see if delays are localized to the foundation crew or if they are a systemic equipment failure issue. Analyzing labor productivity trends helps you adjust upcoming schedules with realistic data. If you want to streamline this process, centralizing your site data is the first step toward true accountability and offensive project strategy.
Optimizing Project Performance with Data-Driven Decision Making
Data isn't just for tracking the past; it's for justifying the future. When you understand how to use a project analytics dashboard in construction, you stop playing defense. You no longer react to crises after they've already impacted your margins. Instead, you use hard data to justify budget increases or schedule adjustments before a project stalls. This transparency turns the dashboard into a tool for active accountability. It ensures that every subcontractor and stakeholder is measured against objective site realities, not subjective opinions.
Adopting an offensive project strategy means using your dashboard to steer the job. If the data shows a consistent lag in a specific zone, you reallocate manpower immediately. You don't wait for the monthly review to find out you're behind. This level of immediacy protects your profit margins and keeps the project moving toward completion without the typical end-of-stage panic.
One-Click Reporting for Stakeholder Transparency
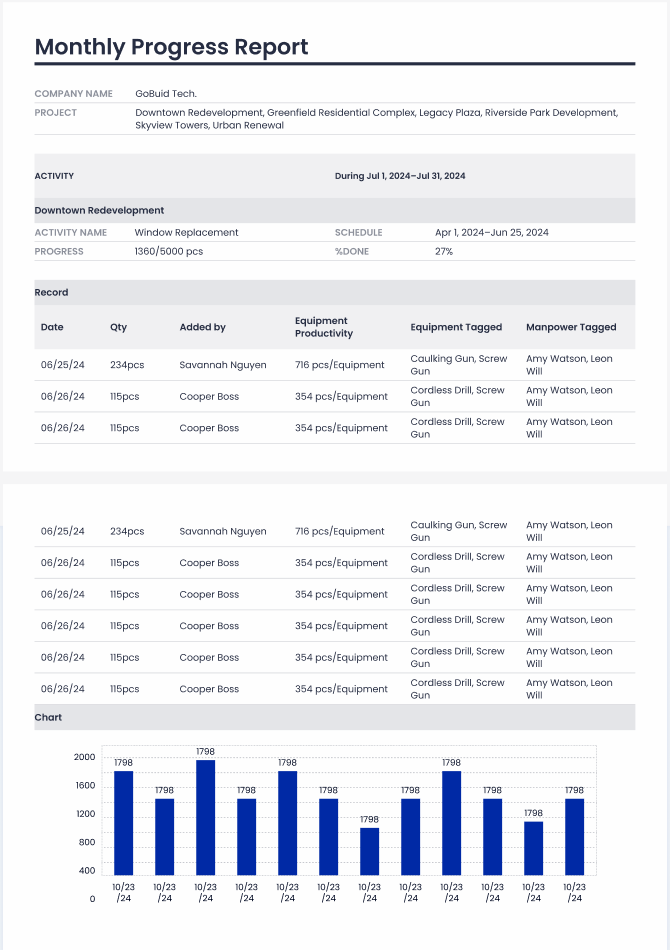
Trust is built on clarity. Manual reporting often feels like a black box to owners and investors, leading to unnecessary friction. You can change that by providing professional, data-backed updates instantly. The ability to generate report in one click directly from your dashboard data saves hours of administrative work. These reports aren't just summaries; they are evidence-based documents that prove your team is meeting its commitments. This level of transparency builds long-term confidence with investors and keeps stakeholders aligned with the project's progress.
Long-Term Gains: Using Historical Data for Better Bidding
Your current dashboard data is a goldmine for your next project. Archived data allows you to analyze actual performance versus your initial estimates. If your earthwork consistently takes 15 percent longer than planned, you can adjust your next bid to protect your margins. This historical view also clarifies equipment needs. Analyze your utilization rates to decide if you should rent or buy for the next job. Data-driven bidding removes the guesswork, ensuring that every new project starts with a realistic and profitable foundation.
Master Your Site Operations with Real-Time Intelligence
Transitioning from manual spreadsheets to a centralized command center is the only way to protect your profit margins. By integrating your site diaries directly into a visual interface, you gain total transparency over every operational location. You've learned that effective management requires more than just observing data; it requires using that data to steer your project. Mastering how to use a project analytics dashboard in construction allows you to identify bottlenecks before they become budget overruns.
Reliable project execution depends on the connection between field documentation and office strategy. You now have the framework to move from defensive reporting to an offensive project strategy that values accountability and precision. Stop losing hours to administrative reconciliation and start making decisions based on live site reality. Leverage real-time manpower and equipment tracking to keep your schedule on track and your stakeholders informed through professional, one-click reporting.
Take control of your job site today. Start your free trial of GoBuid’s Project Analytics Dashboard today and experience the power of a unified data point. Build faster, bid smarter, and execute with confidence.
Frequently Asked Questions
What are the most important KPIs to track on a construction dashboard?
Focus on manpower utilization, equipment idle time, and safety inspection pass rates. These metrics provide the most direct insight into your project's financial health and operational efficiency. Tracking labor hours against the original budget allows you to identify cost overruns early. Monitoring equipment usage helps you decide whether to keep machinery on-site or move it to another location to reduce waste.
How often should a project manager check the analytics dashboard?
You should check your dashboard daily for operational updates and weekly for broader trend analysis. A quick morning review of the Mission Control view ensures you catch missing site diary entries or safety alerts immediately. Weekly reviews are better suited for analyzing productivity patterns and subcontractor performance. This dual-layered approach keeps you informed without overwhelming your daily schedule.
Can a project analytics dashboard help with safety compliance?
Yes, a dashboard centralizes safety and quality inspections to identify recurring risks across your job site. When you know how to use a project analytics dashboard in construction, you can spot patterns in failed inspections or missing safety documentation. This allows you to implement corrective training or site adjustments before an incident occurs. Real-time alerts ensure that critical safety violations are addressed the moment they are logged.
What is the difference between a project dashboard and a static report?
A project dashboard provides real-time data synchronization while a static report is a snapshot of the past. Static reports rely on manual data entry and reconciliation which often results in delayed information. A dashboard acts as a unified data point that updates automatically as field crews enter information. This immediacy allows for proactive decision-making rather than reactive problem-solving after a delay has already occurred.
