The Project Analytics Dashboard: Turning Construction Site Data into Actionable Insights
by Sheldon Huang
|
Most project managers are operating on data that is already 48 hours old by the time it hits their desk. You know the frustration of discovering a 12% manpower shortage three days after it occurred or spotting a safety violation only after the weekly report is filed. It's a chaotic way to run a $20 million job site. Manual data entry errors don't just slow you down; they cloud your visibility and make a Project Analytics Dashboard an absolute necessity for modern site management.
You deserve a single source of truth that bridges the gap between the field and the office. This guide explains how to leverage real-time data to eliminate reporting delays and drive data-backed decisions. We'll show you how to achieve 100% visibility into site diaries and reduce your administrative reporting time by 85%. By the end of this article, you'll know how to implement one-click reporting that ensures BCA compliance and keeps your project moving with the precision of a digital foreman.
Key Takeaways
Replace manual Excel tracking with a real-time visual hub for instant project health updates.
Track essential KPIs like manpower by trade to optimize resources and protect your profit margins.
Bridge the field-to-office gap using a digital site diary to ensure every data point is accurate and verifiable.
Leverage a Project Analytics Dashboard to eliminate reporting lags and gain a single source of truth for your site.
Use historical data trends to simplify BCA compliance and increase the precision of your future project bids.
⭐ Learn more about GoBuid's feature- without the heavy enterprise price tag
What is a Project Analytics Dashboard in Construction?
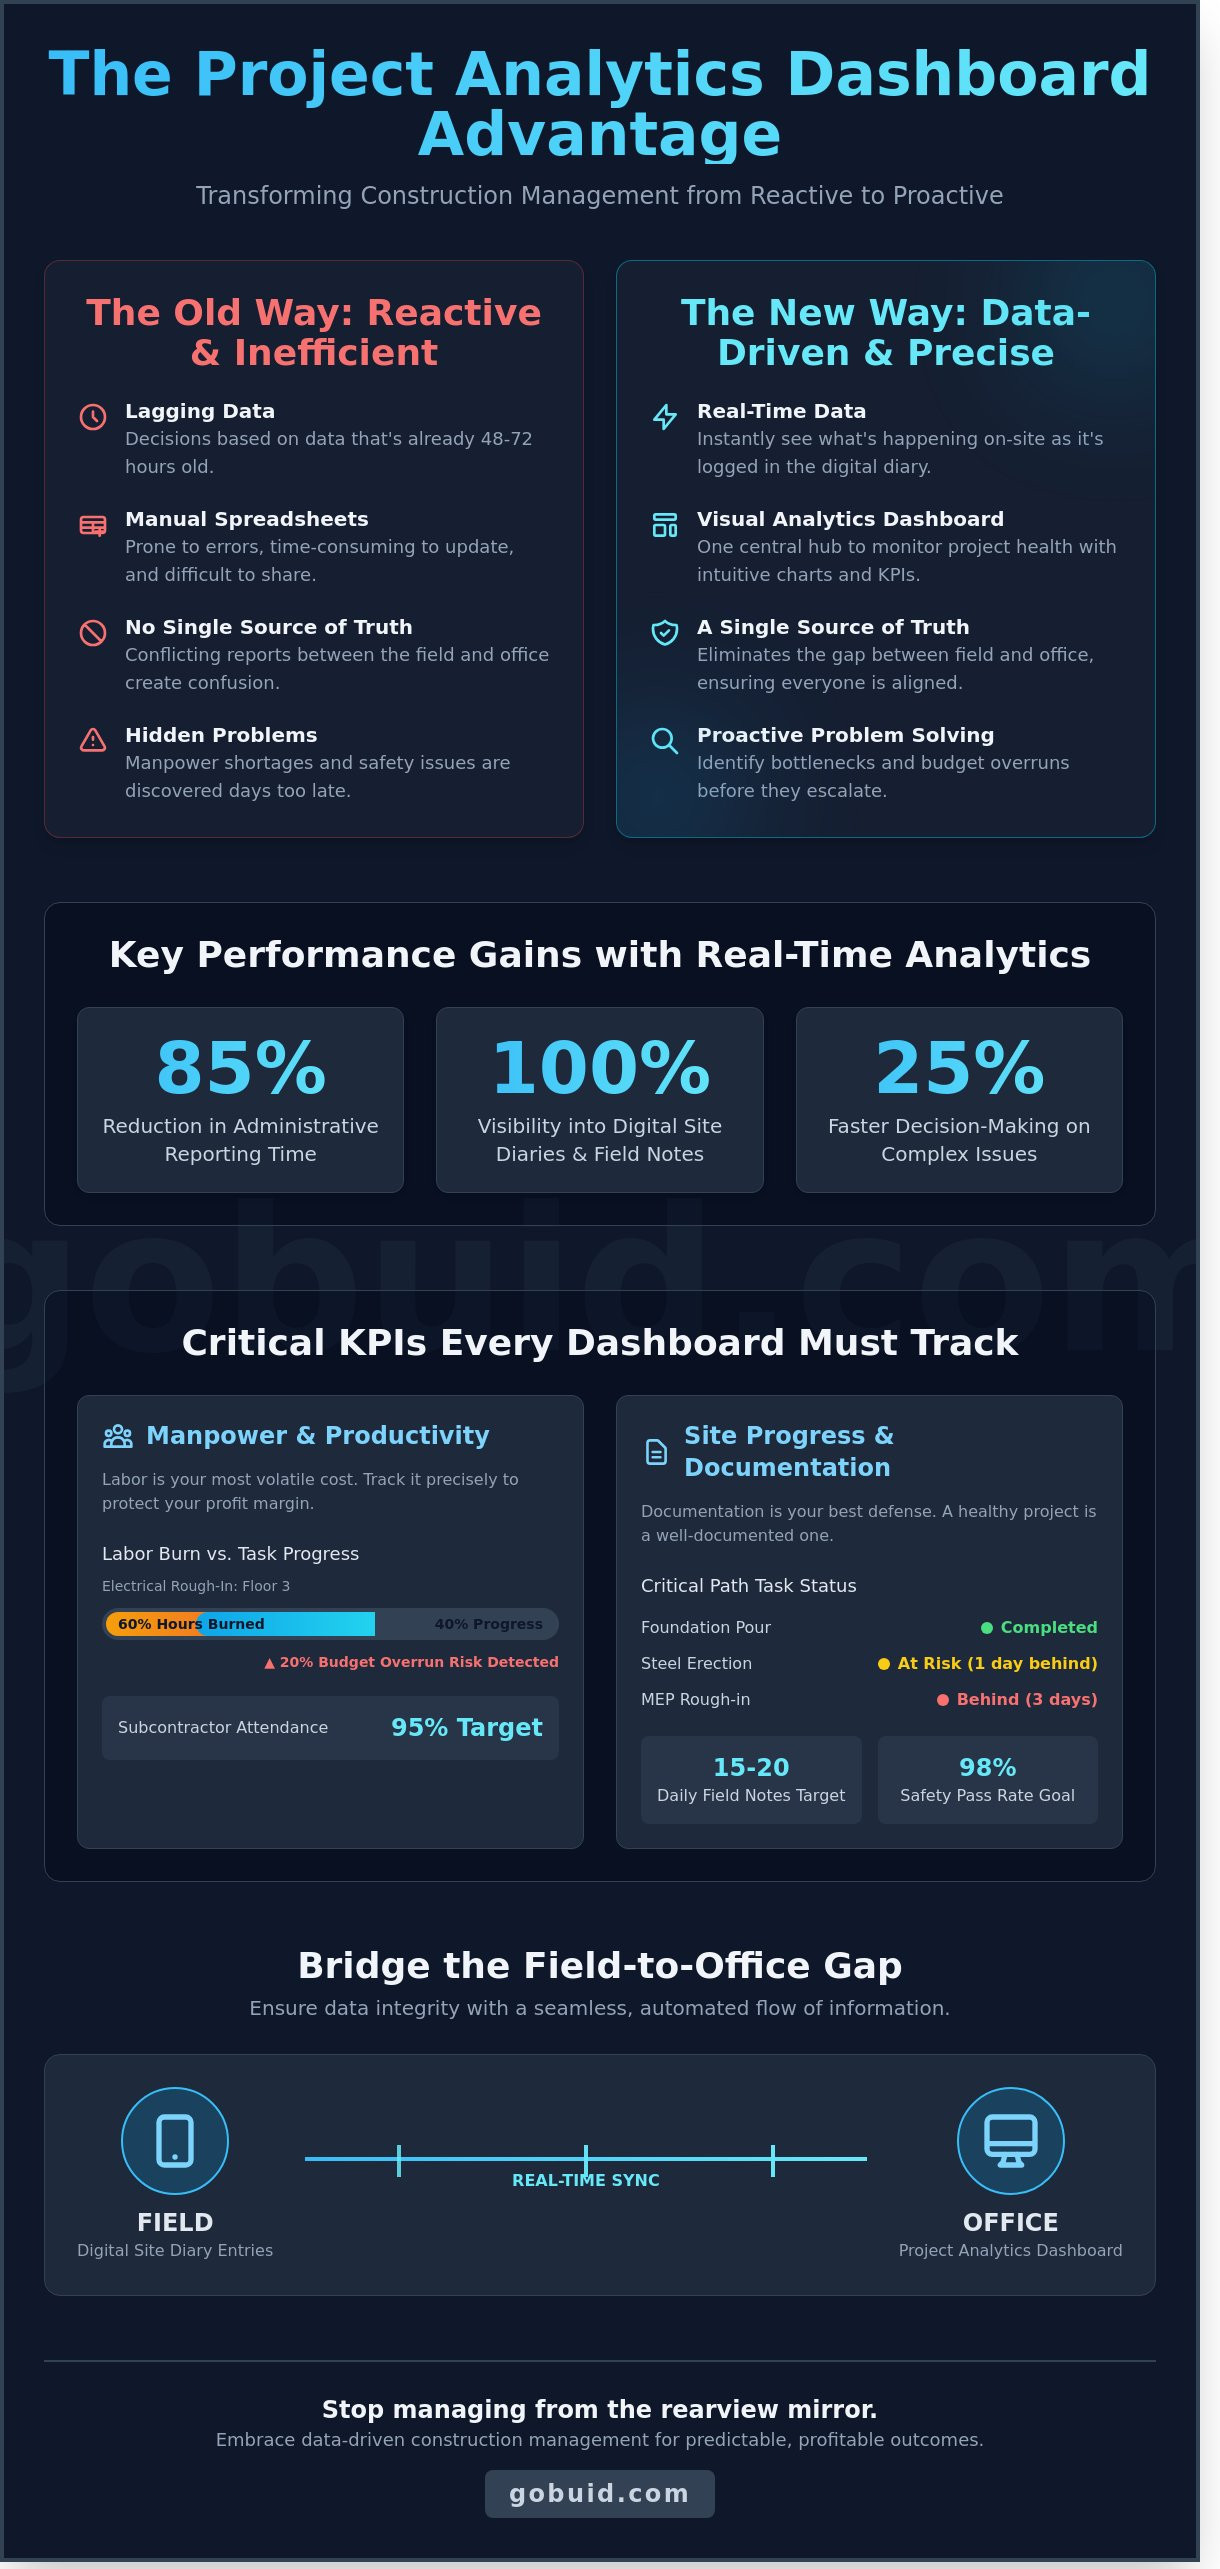
A Project Analytics Dashboard is your command center. It functions as a centralized visual hub that monitors the pulse of your construction project. The old way of managing sites relied on static Excel reports that arrived seven days late. Those delayed spreadsheets are autopsy reports; they tell you why you lost money last week. A digital dashboard provides a live feed of project health, allowing you to catch a budget overrun before it happens.
Modern construction firms use Business Intelligence (BI) strategies to convert raw field notes into profit. This technology creates a Single Source of Truth for your entire team. When the field foreman logs a delay and the office sees it instantly, the gap between the site and the boardroom disappears. You stop reacting to yesterday's crises and start leading with data-driven precision.
Stop wrestling with static spreadsheets and see how dynamic reporting changes the game:
The Core Components of a High-Impact Dashboard
Efficiency starts with real-time data feeds. Your Project Analytics Dashboard should pull information directly from digital site diaries and field reports without manual entry. Visual KPIs track your actual progress against the original 2024 baseline schedule. The system must automate the aggregation of manpower hours, equipment utilization, and material deliveries. This automation ensures your data is 100% accurate and ready for inspection at any moment.
Why Construction Leaders are Moving to Digital Analytics
Administrative overhead is a silent profit killer. A 2023 industry study found that project managers spend 35% of their time just hunting for data. Digital analytics eliminate this waste by centralizing every submittal and punch list. Transparency improves immediately. Stakeholders get the clarity they demand, and project owners see the progress they pay for. Most importantly, these tools identify bottleneck patterns early. You can fix a resource shortage in week three instead of paying liquidated damages in week fifty.
Critical KPIs Every Construction Dashboard Must Track
A Project Analytics Dashboard isn't a luxury; it's a command center for your job site. To protect a standard 10% profit margin, you need to track metrics that actually impact the bottom line. Stop monitoring vanity stats. Focus on the field reality. High-performing teams use these dashboards to bridge the gap between the office and the dirt. Research into data analytics in construction projects shows that real-time visualization can reduce decision-making lag by up to 25% in complex environments. You need to see your equipment utilization rates immediately. If a $200-per-hour excavator sits idle for 5 hours, that's $1,000 lost in a single shift. Tracking these costs prevents silent budget leaks. It's about turning raw data into a single source of truth.
Manpower and Productivity Metrics
Labor is your most volatile variable. Track total man-hours against estimated progress for every work zone. If your electrical crew has burned 60% of their hours but only completed 40% of the floor, you've identified a bottleneck before it becomes a claim. Monitor subcontractor attendance trends to ensure they're meeting the 95% headcount requirement specified in their contracts. Don't ignore the environment. Use your Project Analytics Dashboard to analyze labor productivity dips linked to rain or extreme heat. When productivity drops by 15% due to site conditions, you can adjust the schedule in real-time rather than reacting weeks later.
Site Progress and Documentation Health
Documentation is your best defense against litigation. Track the percent completion of critical path tasks based on daily site diary entries. If a task is 3 days behind, the dashboard should flag it in red. Monitor the volume and frequency of progress photos. A healthy project typically generates at least 15 to 20 field notes per day. Low documentation volume often signals a lack of oversight. You must also track the status of safety inspections and outstanding punch list items. Aim for a 98% pass rate on initial safety walks. Addressing these issues early reduces rework costs by an average of 12%. Centralizing these metrics on platforms built for construction ensures your team stays accountable and the project stays on track.
Solving the Data Integrity Gap: Field to Office
Construction managers often ask the same question: "How do I know the data on the screen matches the reality on the ground?" A Project Analytics Dashboard is only as reliable as the inputs it receives. Garbage in creates garbage out. Buid solves this by turning the digital site diary into a high-precision data engine. It bridges the gap between the rugged job site and the office, ensuring every metric reflects actual progress.
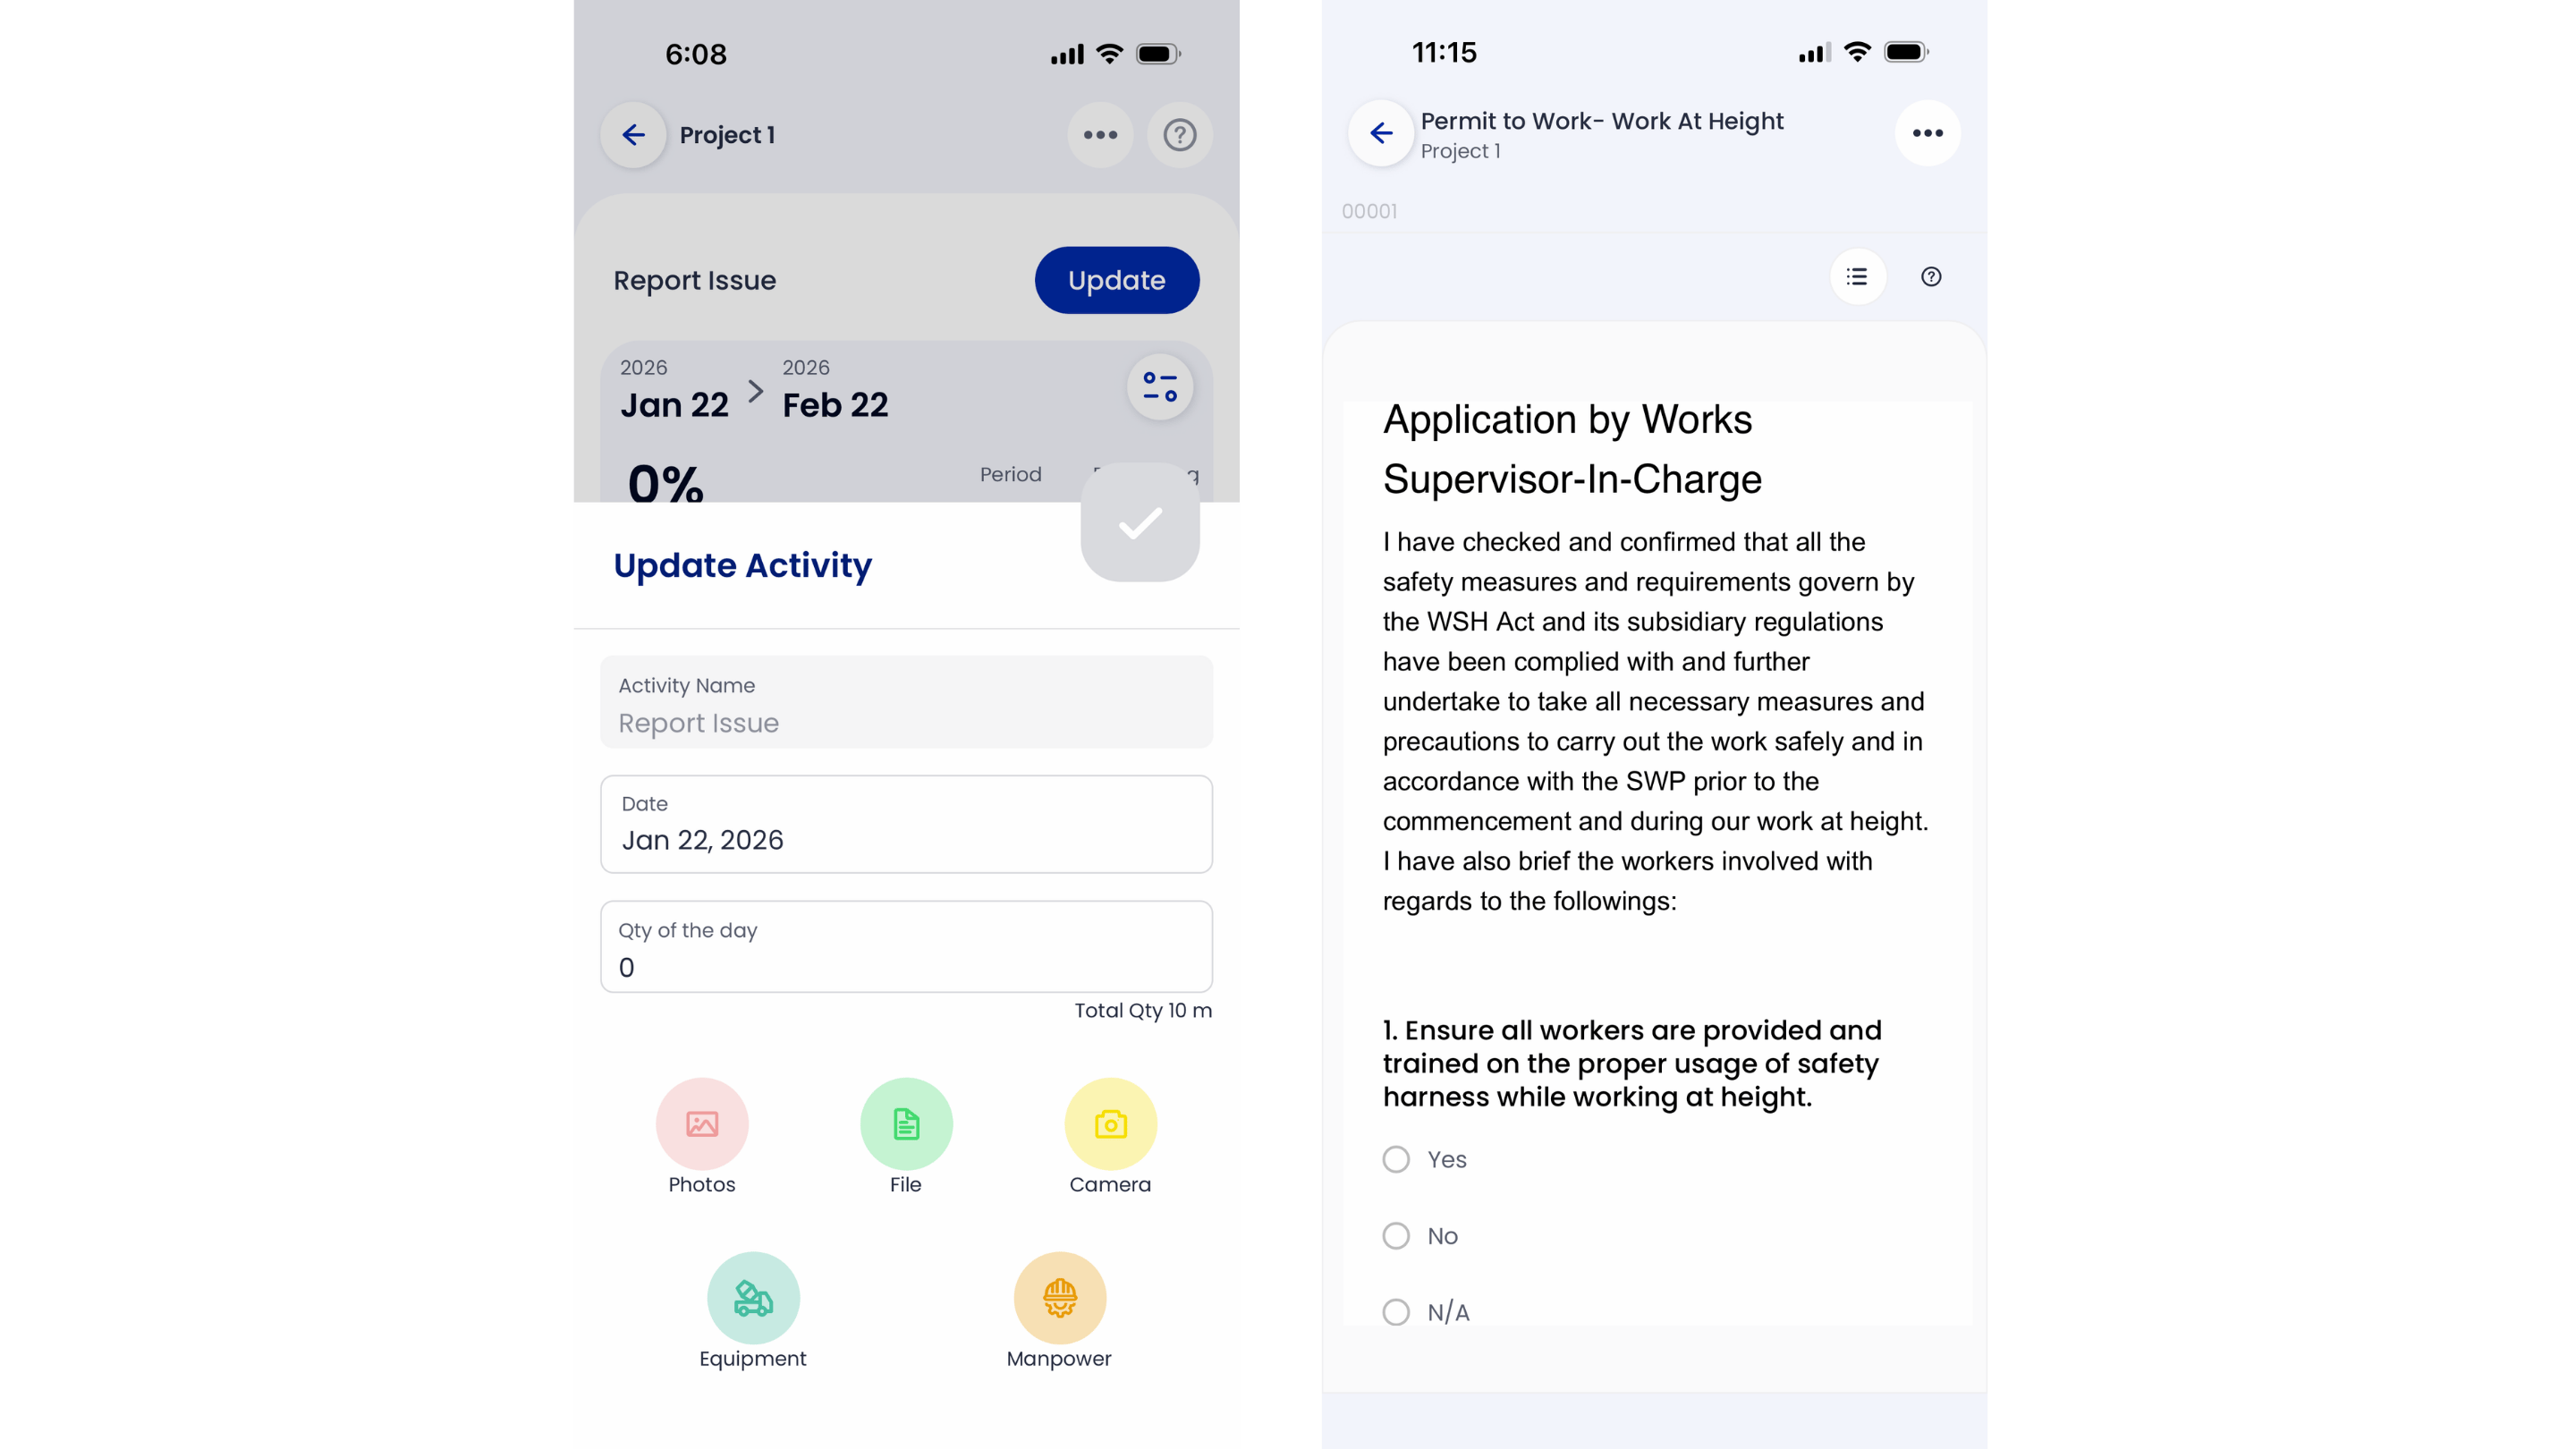
The mechanism is simple. Foremen enter data directly from the field using mobile-first apps. This ensures information is captured as it happens rather than being reconstructed from memory days later. We utilize automated time-stamping and GPS verification to validate every entry. If a report states a concrete pour started at 07:00, the GPS tag confirms the foreman was on-site at that exact coordinate. This creates an unshakeable audit trail that eliminates the "Friday afternoon memory test."
Real-time verification: GPS coordinates confirm site presence for every log.
Immutable logs: Time-stamping prevents back-dating or retroactive "corrections."
Visual proof: Photo-first entries provide a visual record of daily site conditions.
Eliminating Manual Entry Errors
Traditional paper logs result in a 35% data loss rate according to FMI research. One-click report generation stops office staff from "massaging" numbers to look better for stakeholders. Standardized digital forms ensure every foreman collects the same critical data points every single day. This reduces the communication lag from 48 hours down to seconds. The office sees exactly what the field sees without any filters or transcription errors.
Empowering Foremen with Simple Tools
A Project Analytics Dashboard fails if the field tool is clunky. Foremen need to build, not type. Buid prioritizes voice-to-text and photo-first documentation to keep the crew moving. A foreman can record a site observation in 15 seconds while walking the slab. This bridges the communication gap between site supervisors and project managers. Reliable data flows because the software respects the foreman's time and simplifies their daily routine.
Using Analytics to Drive Compliance and Profitability
Data isn't just a record of the past; it's your strongest defense and your most aggressive growth tool. A high-performing Project Analytics Dashboard transforms raw site metrics into a roadmap for higher margins and zero-penalty compliance. You stop reacting to crises and start preventing them. Visibility is the difference between a profitable handover and a project that bleeds cash through liquidated damages.
Streamlining Regulatory Compliance
Audit readiness shouldn't take a week of manual paperwork. Use your dashboard to maintain a real-time digital trail of every safety inspection and permit. When BCA inspectors arrive, you provide a centralized source of truth that leaves no room for doubt. Many firms spend 15 hours a week on documentation; Buid users cut this by 65% through automated site diaries. These digital logs meet national record-keeping standards automatically. You generate compliance reports in one click, providing external stakeholders with the transparency they demand without the administrative headache.
Predictive Management: Spotting Delays Early
The construction industry faces a 20% labor shortage projected to last through 2026. You can't afford wasted hours or misallocated crews. Use trend lines to forecast potential project overruns months in advance. If your productivity data shows a 7% dip in masonry speed over a 14-day period, adjust your resource allocation immediately. Don't wait for the end-of-month review to find out you're behind. Conduct a root cause analysis by correlating site data; identify if a delay stems from specific weather patterns, equipment downtime, or sub-contractor bottlenecks. This level of visibility turns a potential $50,000 delay into a minor, manageable schedule adjustment.
Profitability also lives in your project archives. Leverage historical data to price your next project with surgical precision. If your last three commercial builds ran 12% over budget on HVAC submittals, adjust your future bids to protect your bottom line. Better equipment management offers another clear path to cost savings. Track idle time across your entire fleet. Reducing idle time by just 10% can save a mid-sized contractor $12,500 annually in fuel and maintenance costs. Finally, use every documentation log to defend against potential legal or delay claims. When a dispute arises, your Project Analytics Dashboard provides the timestamped, photographic evidence needed to prove your case and avoid costly litigation.
Stop guessing and start winning with data-driven site management. See how Buid protects your margins.
GoBuid: The All-in-One Analytics Solution for Builders
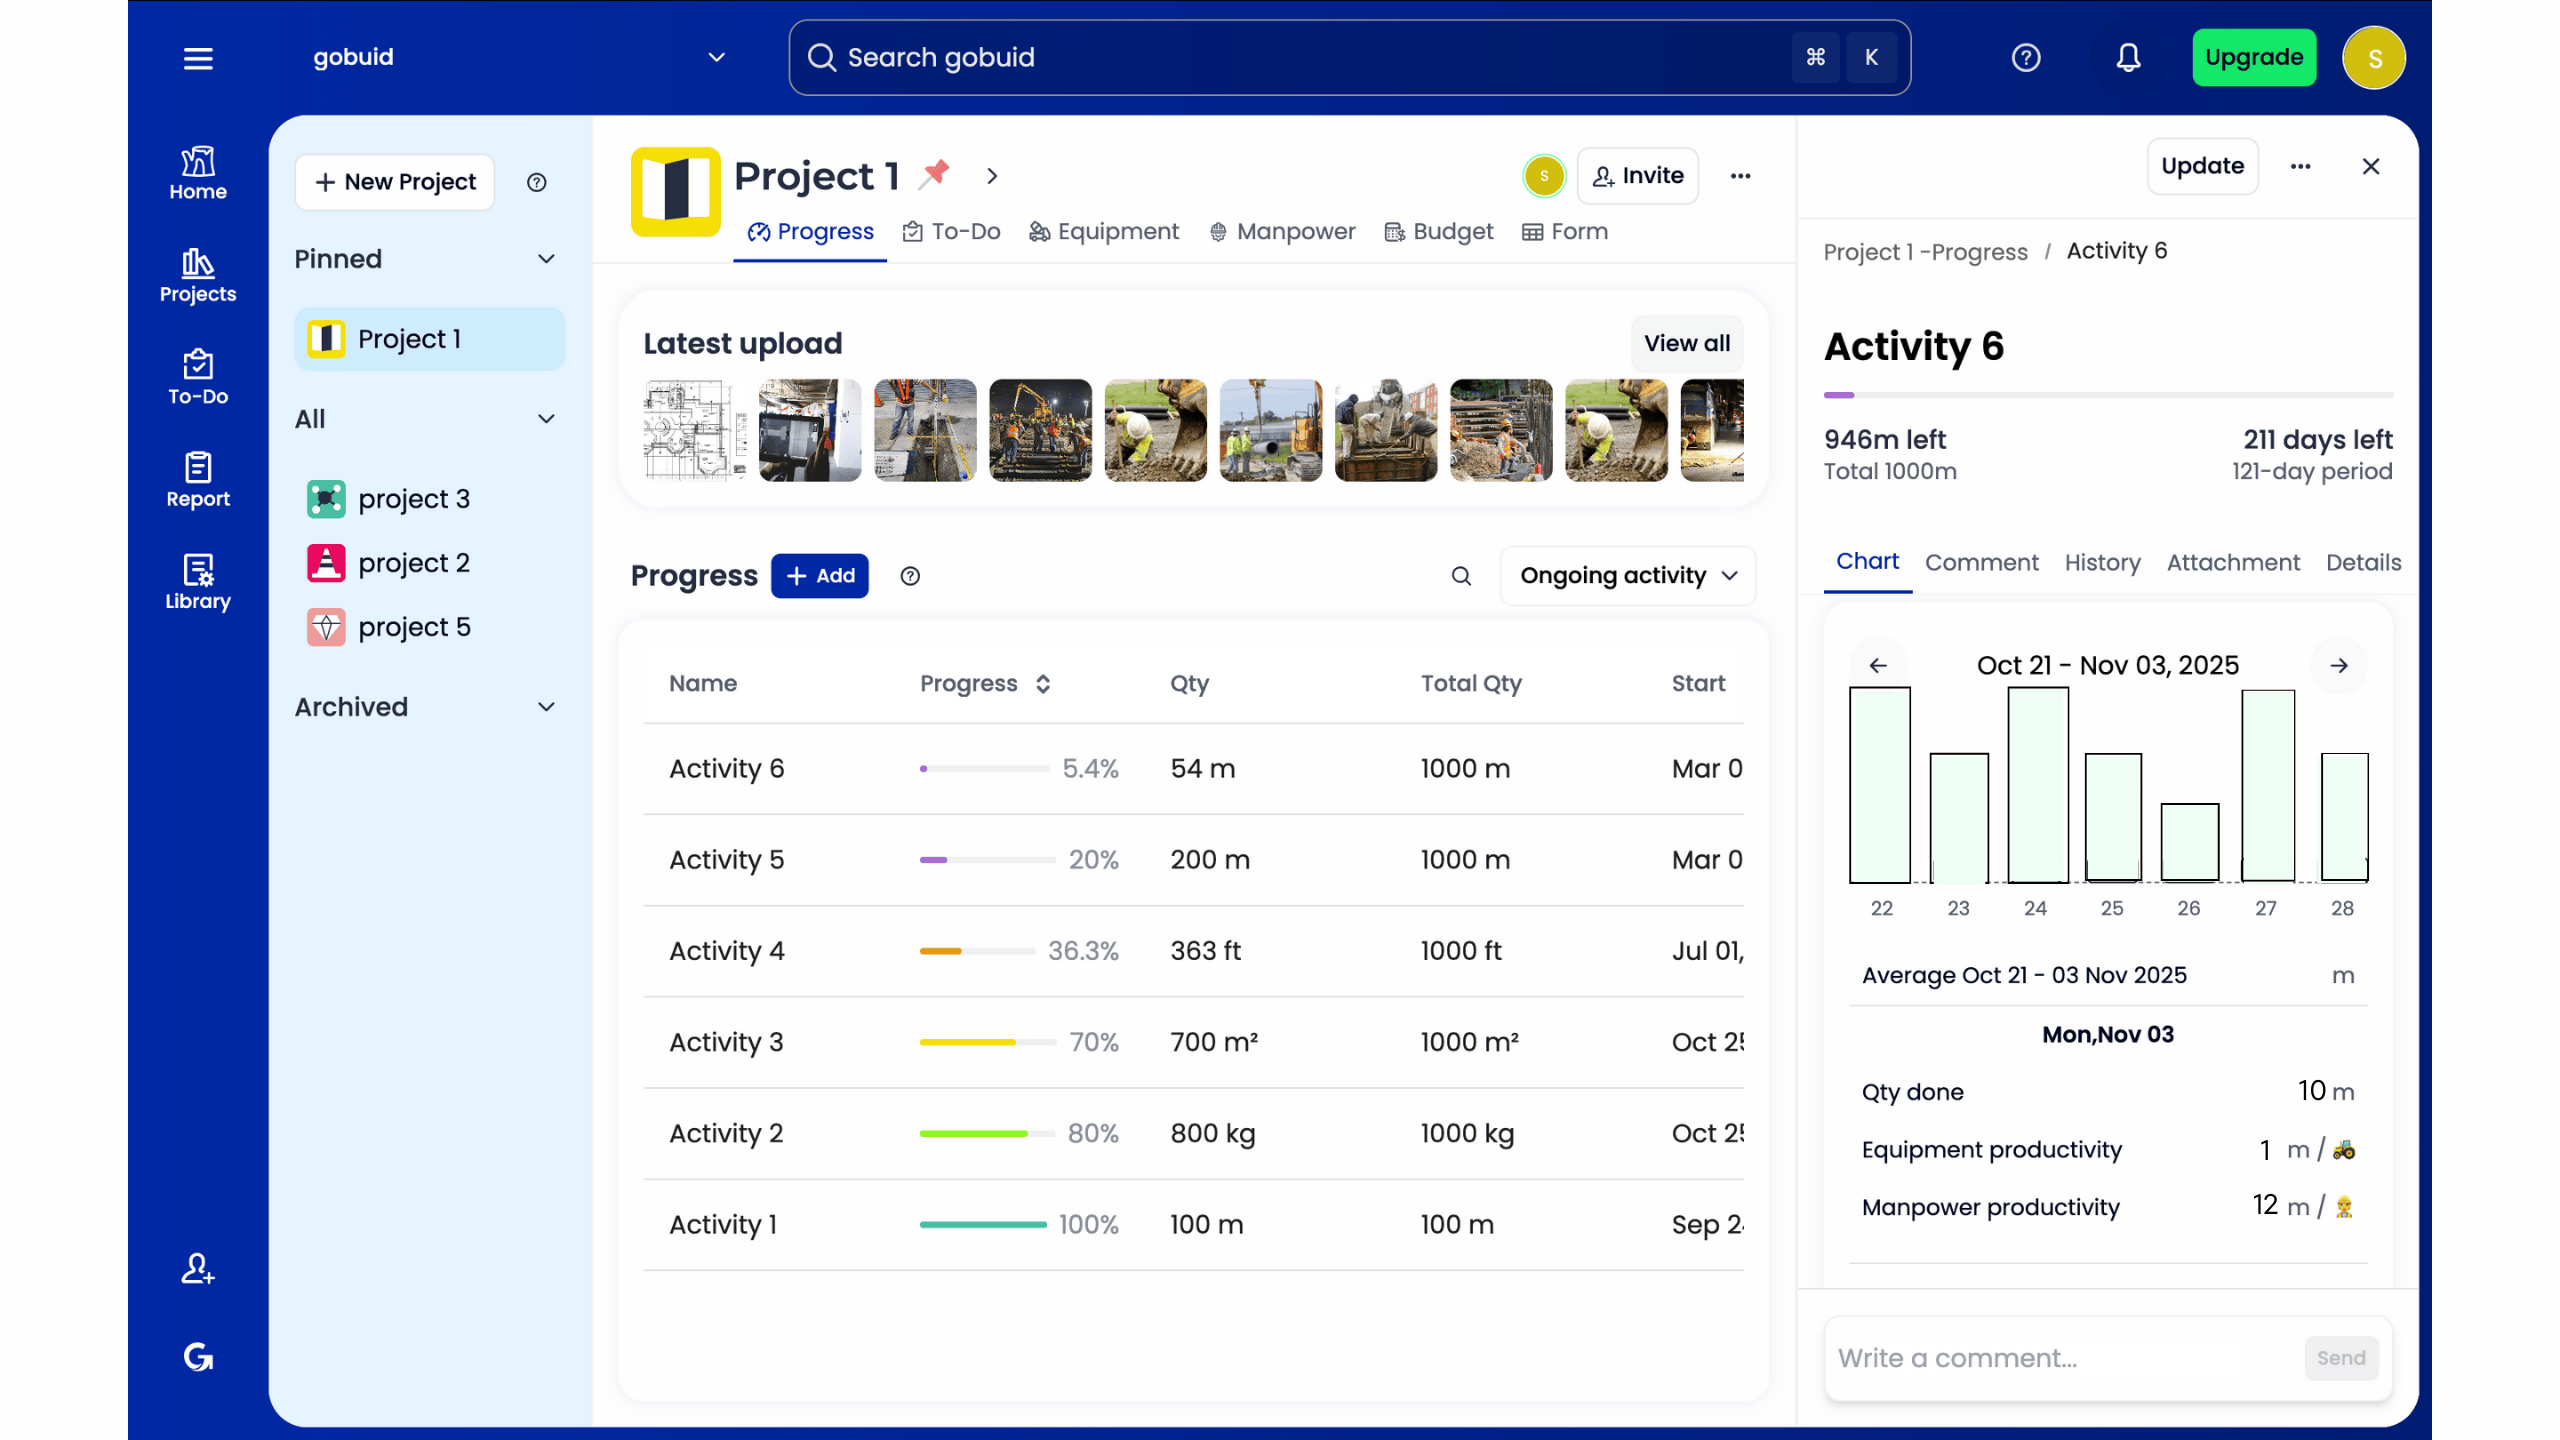
GoBuid is the professional choice for modern contractors who value agility over bureaucracy. We've stripped away the bloat found in traditional enterprise tools to deliver a lean, high-performance platform. Our "No Lock-in Contract" model respects the project-based reality of construction. You pay for what you need, when you need it, without being shackled to 36-month commitments. This flexibility allows firms to scale their software costs in direct alignment with their current contract pipeline, ensuring overhead never outpaces profit. By integrating site diaries, manpower tracking, and real-time data, GoBuid transforms your field activity into a comprehensive Project Analytics Dashboard that actually makes sense.
Our platform acts as the connective tissue for your project, centralizing critical data points including:
Automated Site Diaries: Capture daily progress, weather conditions, and delays without the paperwork.
Manpower Tracking: Monitor subcontractor hours and headcount to prevent budget overruns.
Real-Time Analytics: View productivity trends and labor costs through a single source of truth.
Document Control: Centralize photos and submittals so nothing slips through the cracks.
Why GoBuid is Different
Accuracy starts in the mud. GoBuid is built field-first, ensuring that foremen can input data in seconds on a mobile device. This ground-up approach guarantees the office receives 100% accurate data, preventing the "garbage in, garbage out" cycle that plagues most tech adoptions. Project Managers save an average of 12 hours per month by using our one-click reporting feature. Instead of chasing paper trails or deciphering messy handwriting, you generate professional, branded PDF summaries instantly. Our customizable forms adapt to your specific workflow, whether you're managing civil works, fit-outs, or high-rise structures.
Get Started with Better Visibility
Stop guessing and start knowing. You can configure your first project and see live data in under 15 minutes. Transitioning from paper diaries to a digital powerhouse eliminates the 20% data loss typically seen in manual entry systems. GoBuid creates a reliable audit trail that keeps every stakeholder accountable and every margin protected. It's time to bridge the gap between the site and the boardroom. Book a GoBuid demo today to see how we turn chaos into clarity. Our team will show you exactly how to leverage your Project Analytics Dashboard to hit your milestones and protect your bottom line.
Take Command of Your Construction Data
Construction success depends on moving past guesswork. A centralized Project Analytics Dashboard transforms raw field data into a strategic asset. By bridging the gap between site activity and office management, you ensure that every dollar spent is accounted for in real time. Reliable data integrity means you can stop chasing paper trails and start making informed decisions that protect your margins. Singaporean contractors currently use GoBuid to maintain a single source of truth across complex job sites. It's the most effective way to manage high-stakes projects.
Efficiency shouldn't be complicated. You can generate comprehensive reports in 1 click, allowing your team to focus on building rather than manual data entry. Our platform provides 24/7 visibility into manpower and equipment tracking; giving you the exact numbers needed to drive compliance and profitability. It's time to replace chaotic workflows with the sleek precision of modern software. Build faster, smarter, and with total confidence in your project data.
Start your free trial of GoBuid today; no lock-in contracts
Frequently Asked Questions
What is the primary benefit of a project analytics dashboard in construction?
The primary benefit is centralized visibility that eliminates information silos across the job site. A Project Analytics Dashboard converts raw field data into a single source of truth for the entire team. Instead of chasing 15 different spreadsheets, managers see real-time progress instantly. This transparency reduces manual reporting time by 80% and ensures every decision relies on verified site data rather than guesswork.
How does a dashboard improve BCA compliance for Singaporean projects?
Dashboards automate the documentation required for Singapore's Integrated Digital Delivery standards. They ensure 100% compliance with BCA’s 2023 regulatory requirements by capturing digital signatures and timestamps on every inspection. You’ll maintain a tamper-proof audit trail that satisfies CORENET submissions without manual filing. This digital approach eliminates the 25% administrative overhead typically spent on paper-based compliance workflows.
Do I need a dedicated data analyst to manage a project dashboard?
You don’t need a dedicated data analyst because the software automates the entire processing chain. The platform handles complex data aggregation in the background, presenting insights through pre-built templates. Project managers can master the interface in a single 30-minute session. By removing the need for a $90,000 per year specialist, the system makes high-level analytics accessible to every site supervisor.
Can a project analytics dashboard track subcontractor performance?
Yes, the dashboard tracks subcontractor performance through specific metrics like rework rates and schedule variance. You can view a side-by-side comparison of 12 different trade partners to identify who meets safety standards and who causes delays. This level of accountability reduces dispute resolution time by 50%. It turns subjective observations into concrete performance data that informs future procurement decisions.
What is the difference between an operational and a strategic dashboard?
Operational dashboards focus on daily site activities like current manpower and equipment uptime. Strategic dashboards aggregate data across 5 or more projects to track long-term profitability and resource allocation. While the operational view helps a foreman manage today’s pour, the strategic view helps executives predict quarterly margins. Both views utilize the Project Analytics Dashboard to bridge the gap between field execution and corporate goals.
How often is the data on a GoBuid dashboard updated?
Data on the GoBuid dashboard updates in real-time as soon as field staff sync their mobile devices. There’s zero lag between a site inspector hitting submit and the dashboard reflecting the new status. This instant synchronization ensures that 100% of your reporting reflects current site conditions. You’ll never make a decision based on data that's 24 hours old or wait for end-of-week manual updates.
Will a digital dashboard help in resolving construction delay claims?
Digital dashboards provide the objective evidence needed to resolve delay claims within 48 hours. By maintaining a chronological log of weather conditions, site photos, and daily reports, you create an indisputable record of events. This transparency prevents the arguments that often lead to expensive litigation. Having 100% digitized site diaries can reduce legal costs by 30% during contract disputes.
Is it difficult to train site foremen to use the apps that feed the dashboard?
Training site foremen takes less than 15 minutes due to the intuitive, mobile-first design. The apps mirror familiar social media interfaces, making them accessible to users regardless of their technical background. We’ve seen a 95% adoption rate among field crews within the first week of deployment. When the tool simplifies their daily paperwork, site teams naturally gravitate toward the digital solution.